Showing posts with label Map Catalog. Show all posts

WindRose

Windrose charts like this one from Tuscon Arizona make it easy to visualize the wind patterns for an area for a particular month this one is from February. The colors tell the wind speed and the length that the pedal extends tells the pernent of time the wind blows and of course the direction.
http://www.philip-lutzak.com/weather/Meteo%20410/PROJECT%203/PROJECT_3%20Page%202%20Tucson%20Climatology.htm

Shaded Releef Map


This is a shaded releif map of Arizona. The shading gives a clear picture of the terrain and different elevations. The lowest elevations are bright green with the highest elevations being shaded purple and forest makes up the green and yellow.

Propoganda

I thought this map was really neat and unique. It shows the world at the start of world war one from an Asian point of view. The map was created in Japan in 1914
bibliodyssey.blogspot.com/.../asia-on-world.html

Box Plot

This box plot is from a site about Montana and it shows the Red River discharge for the month of March. The website also includes a chart that give the infomation for April. May, June and July as well.
http://www.math.montana.edu/~nmp/materials/ess/hydrosphere/expert/rrf/box1.gif

Star plot

This is an example of a star plot. This particular map shows the crime rate in various major US cities.

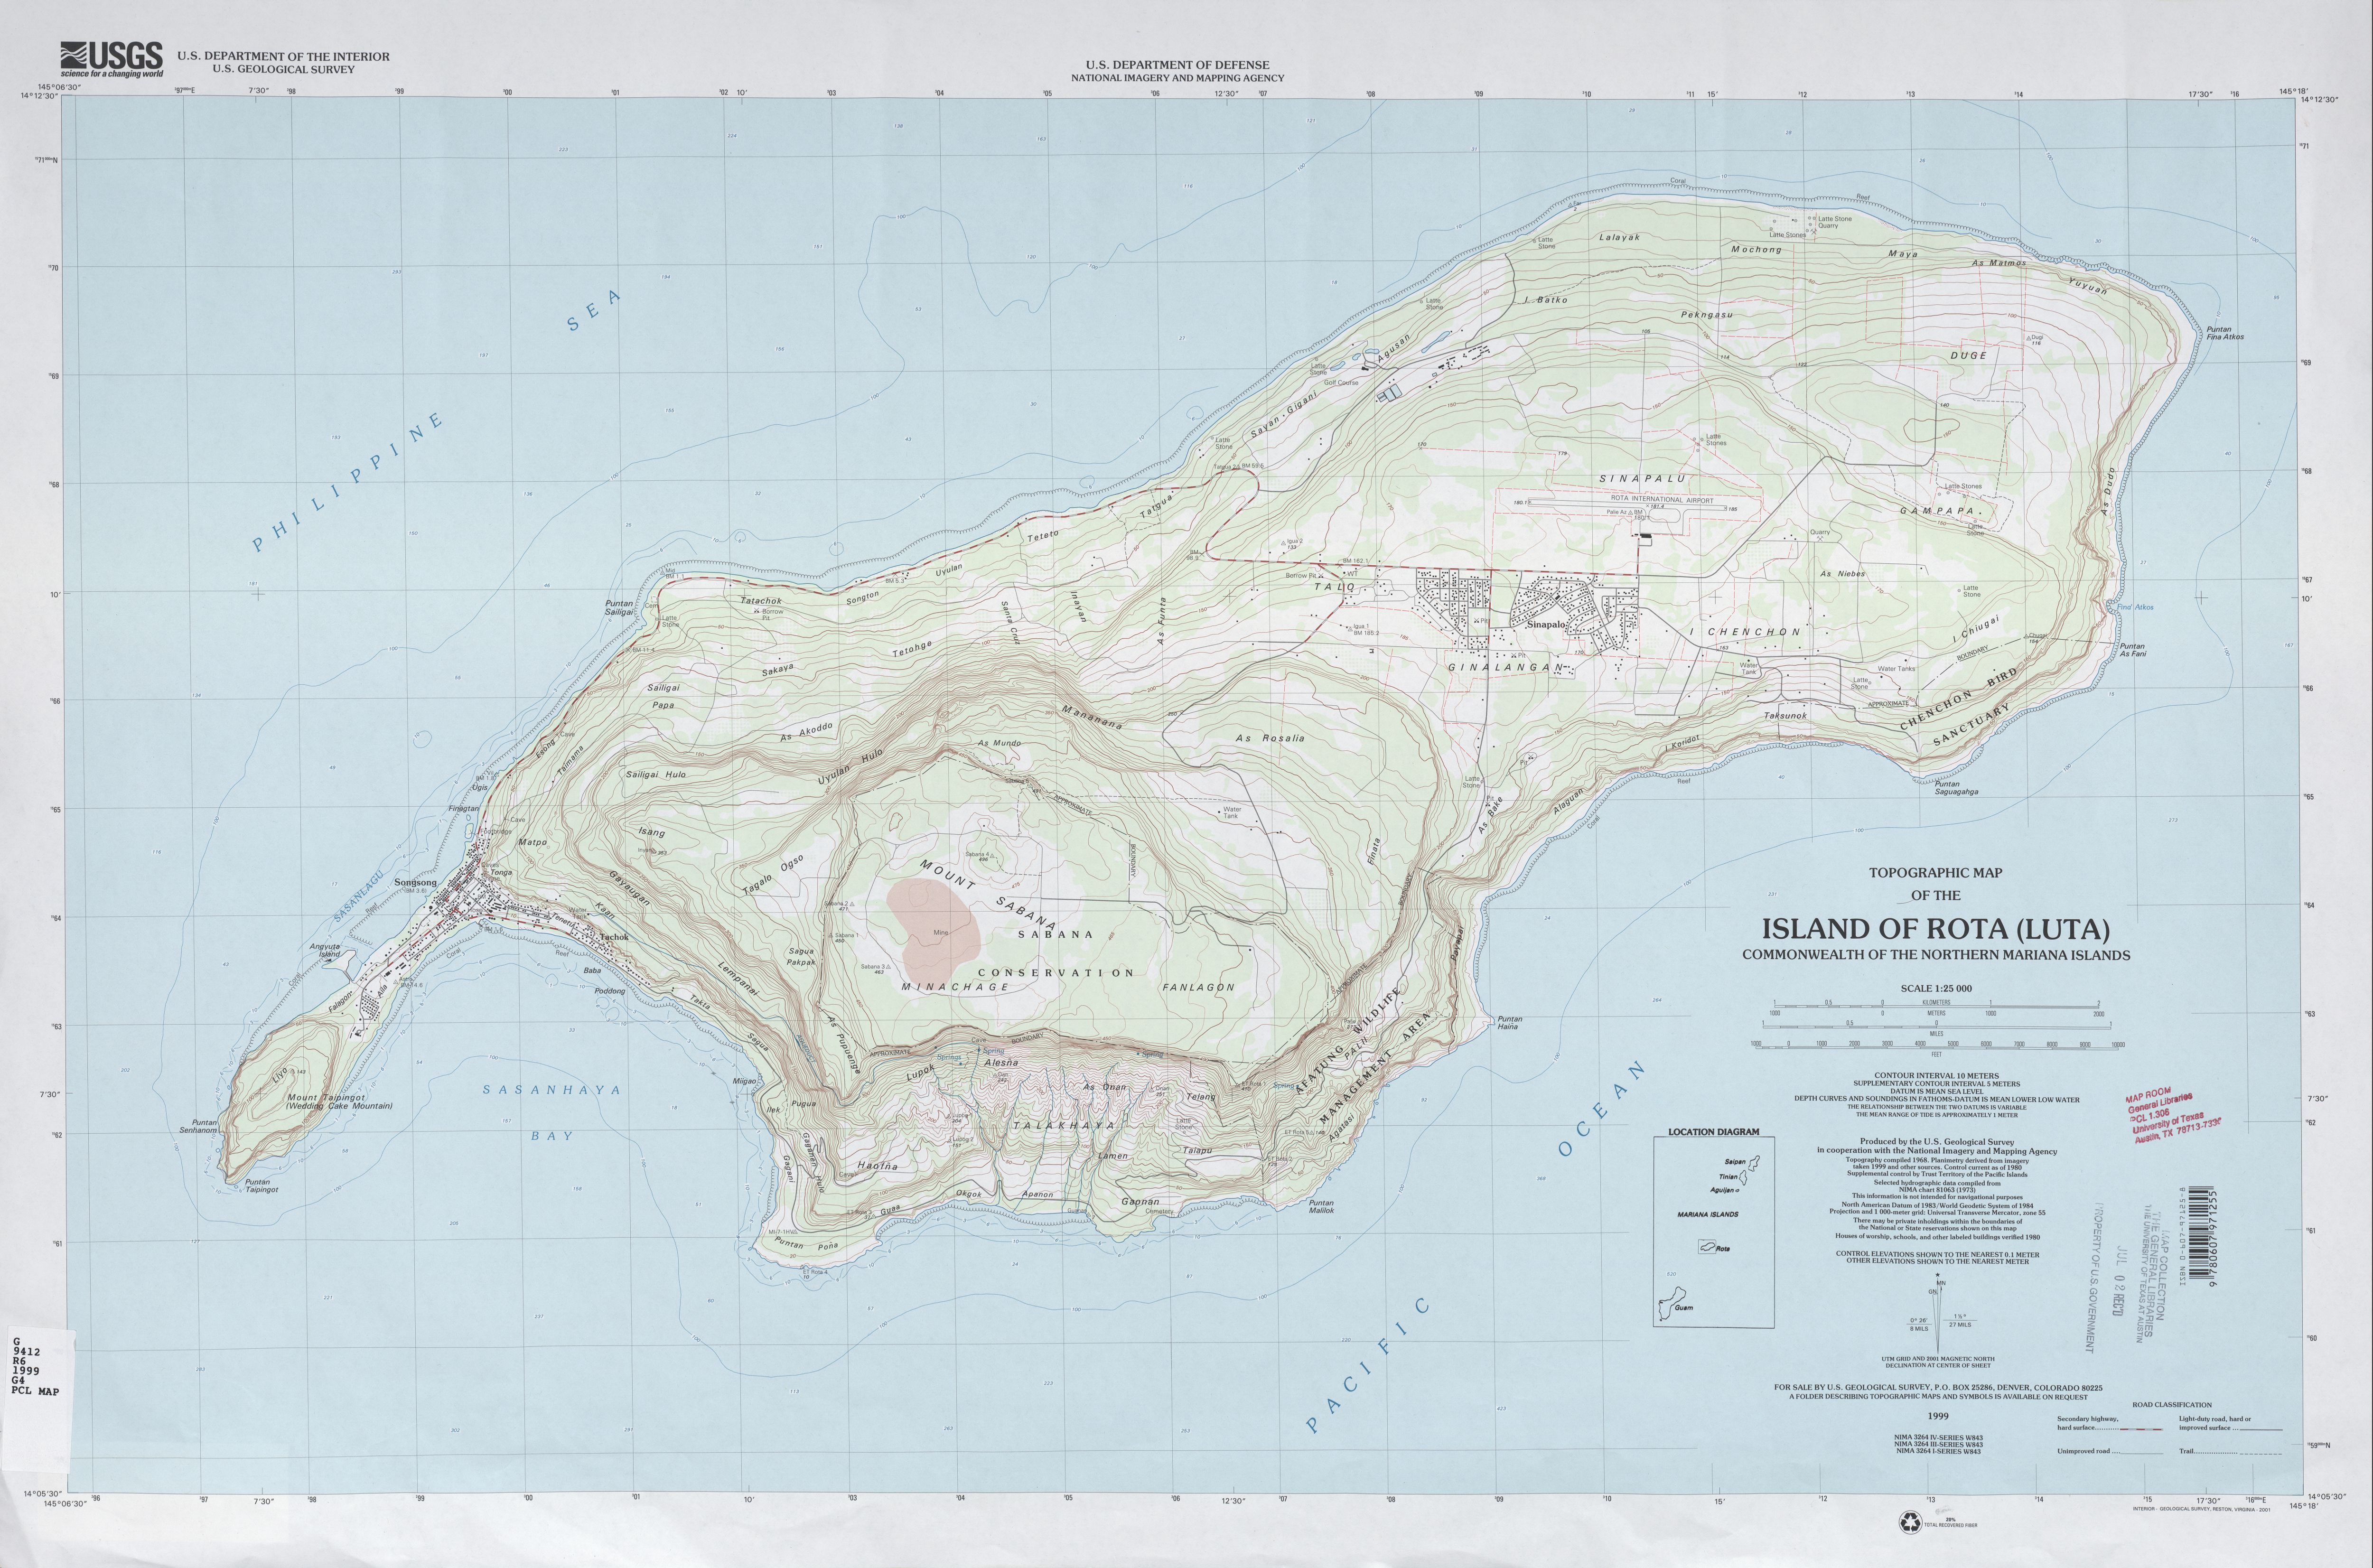
Topographic Map

This is a topographic map of the Island of Rota in the CNMI. What I found interesting is the steep incline on the Southern part particularly the South West side. The North side of the island has a much more gradual incline.

PLSS map

This PLSS map is of Kirkland Washington. The ellipsoid is Geodetic Reference System 1980 (GRS 80). The horizontal datum is North American Datum of 1983 (NAD 83/91) and the vertical Datum is Vertical Datum of 1988 (NAVD 88).

Doppler Radar

This is a Doppler Radar image of Hurricane Andrew as it hit Miami. I like how it has included some street names to really give a feel for where it is. It is interesting to see how different each band is especially with the blackness of the center where the decibels of z are so low then the how quickly it turns to bright red on the complete opposite side of the dBZ scale.